Heat mapping is the process of recording surface temperatures to identity extreme hotspots and target new plantings and cooling infrastructure.
You can map your garden, community space or school grounds in order to:
- Identify hot spots (the places where cooling is most needed) and plan climate cooling action.
- Compare different surface temperatures, showing how much cooler planted areas are compared to bare soil or hard surfaces.
- An infrared thermometer gun (costs about £10). Simpler, cheaper thermometers can still give you an idea.
- A means of jotting down your findings, eg a notebook, audio recorder, site map or record sheet (a sample record sheet is included in the downloads below).
- Some sunshine to warm up the surfaces. You don’t need strong sunlight, light cloud is okay.
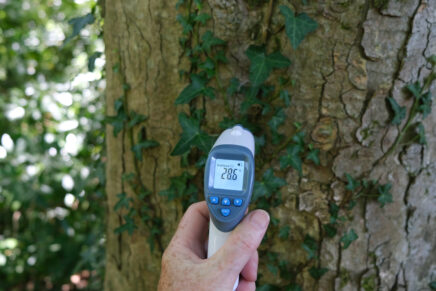
- Point the thermometer just above the surface and take and record your reading.
- Repeat 2-3 times at each location to check the results are consistent.
- Move around the space, measuring different surfaces and locations. Make sure you measure surfaces that have been in the sun rather than those that have been in the shade all day.
- For hotspot mapping, draw a site map and mark the findings so you can identify the areas with the highest temperatures.
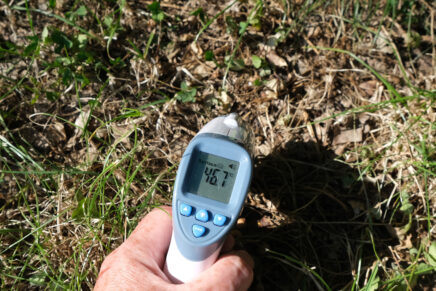
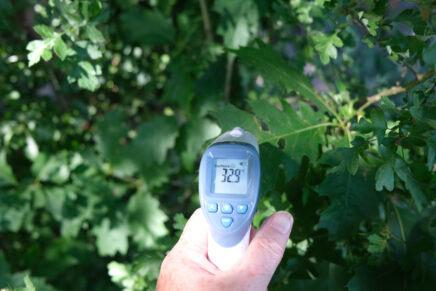
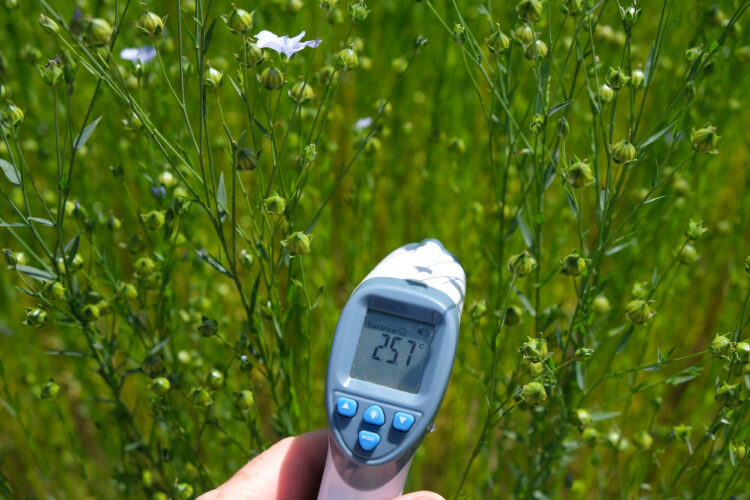
Heat mapping can show a clear contrast between the temperature of bare soil compared with the leaves of a tree.
If digital thermometers aren't available, or if they aren't straightforward to use by some participants, there are alternative options for comparing surface temperatures. For example:
- Using a talking thermometer which provides an audio temperature reading.
- Placing a hand on a surface is a means of comparing between different surface temperatures.
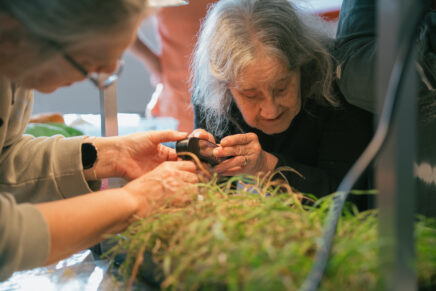
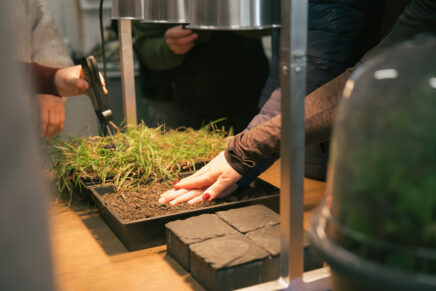
You can use the findings to demonstrate some key principles, for example:
- Hard ground surfaces, bare soil and bare walls become very hot and create hot-spots.
- In comparison, plants create cooling, which protects the surrounding areas from over-heating.
- While some of the cooling effect of plants is from shading, there is a noticeable cooling from leaf surfaces which results from transpiration.
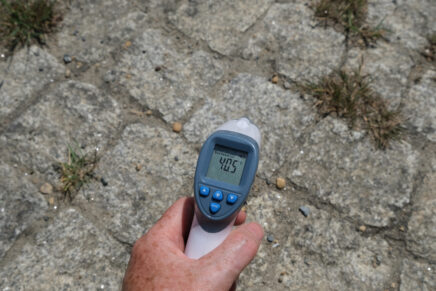
You can also use the findings to make plans for climate cooling action, for example:
- Identify areas where you need to add plants to create more cooling.
- Options for reducing the area of hard surface, eg by lifting paving slabs to introduce more plantings, or adding more planted containers.
- Covering areas of bare soil with mulch or plantings.